


Gone are the days of one-size-fits-all reports in business intelligence. As an analyst, I'm constantly fielding requests from stakeholders across departments, each with unique needs. The core data might be the same, but the way they want it sliced and diced is anything but.
Imagine this scenario: You craft a sales report for marketing, pulling daily gross sales data by order creation date – perfect for their fast-paced, reaction-oriented world. A few weeks later, finance swoops in with a similar request. Their focus? Net sales, naturally, aggregated monthly to match their accounting cycle. They also need data grouped by shipping date, since, in their world, orders aren't "real" until they hit the shipping dock.
As you can see, these are two distinct needs stem from the same well of data. Building and maintaining separate reports for each stakeholder is a recipe for wasted time and resources – think server strain from scheduled queries and the sheer tedium of ongoing maintenance.
But what if there was a way to create a single, dynamic report that bends to the will of each department? Enter the magic of dynamic filters... Today, we'll dive into the four dynamic filter superstars that'll transform your reports into self-service havens:
Date Grouping Chameleon
- Effortlessly switch between date groupings
created_at,shipped_at,delivered_at, etc.
- Effortlessly switch between date groupings
Date Aggregation Transformer
- Morph daily data into daily, weekly, monthly, quarterly, or yearly insights with a simple click.
Dimension Shifter
- Dynamically select the grouping dimension – be it
Country,Channel,Payment Provider, etc.
- Dynamically select the grouping dimension – be it
Measure Maestro
- Swap between measures (IE
Orders,Net Sales,Gross Sales,Costs, etc) on the fly, letting users focus on the metrics that matter.
- Swap between measures (IE
By combining these filters, you'll empower stakeholders with a self-service dashboard. They can configure it to their needs, even exporting data to CSV for deeper dives. This translates to fewer ad-hoc requests, freeing you to tackle high-impact analytical projects.
Check out the demo I created in Tableau to witness the magic firsthand: Self-Service in Tableau - A Dynamically Filterable Report Example
Here's a breakdown of how to implement them in your own reports:
Date Grouping Chameleon
Let users effortlessly switch between groupings created_at or shipped_at using a simple parameter.
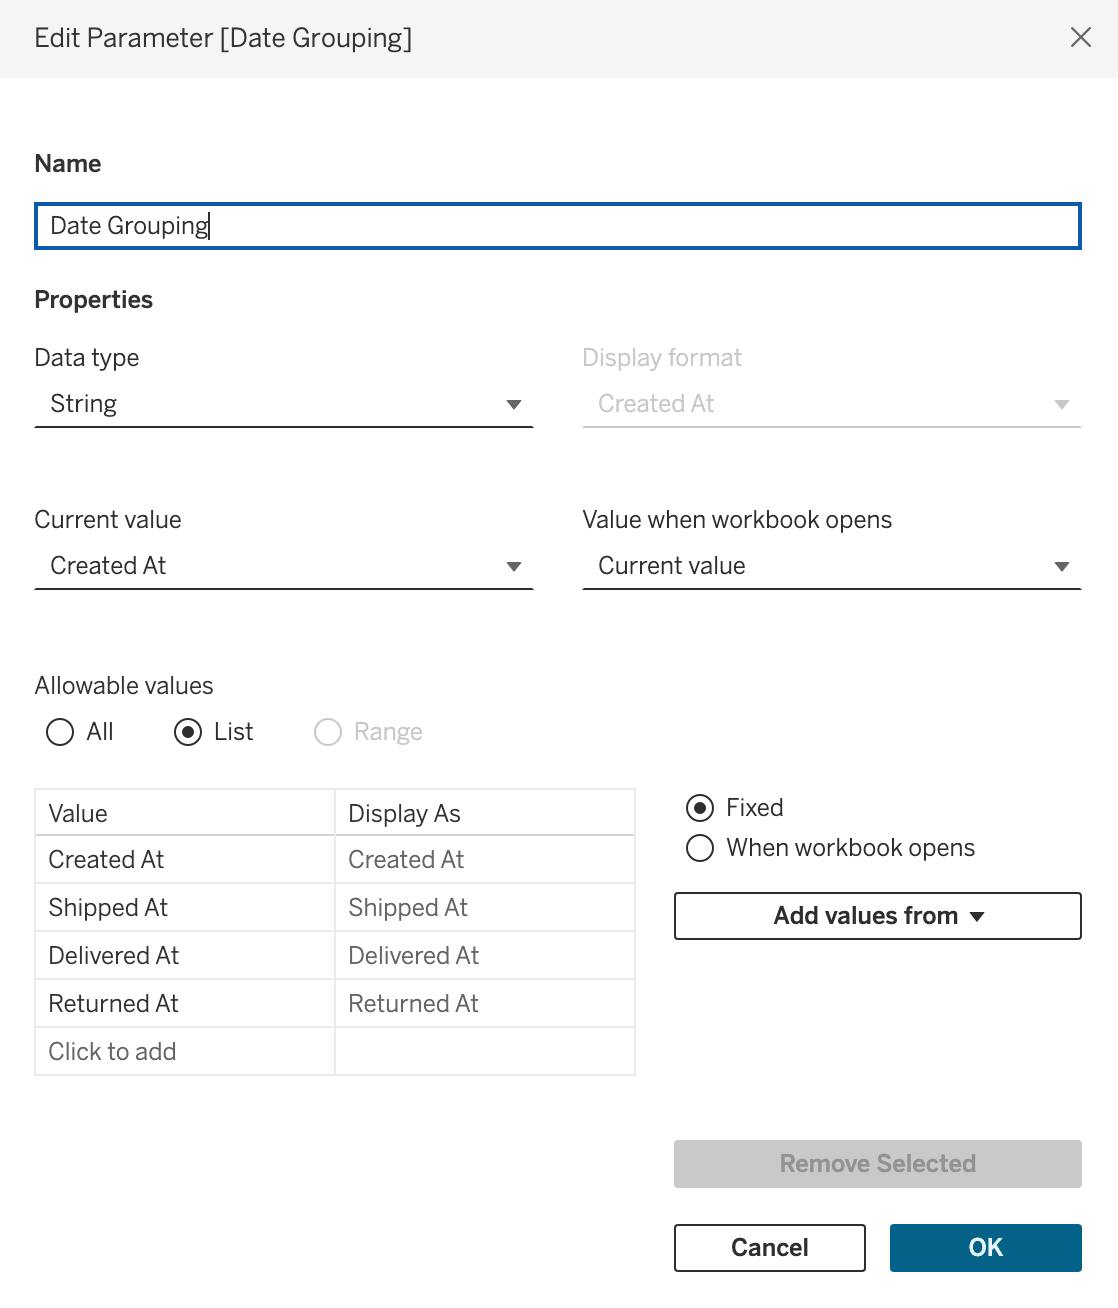
1. Create the Parameter:
Go to the "Data" menu and select "Create Parameter."
Give your parameter a name, like "
Date Grouping."Set the data type to "String."
Under "Allowable Values," choose "List."
Enter the values for your dates:
created_atandshipped_at.
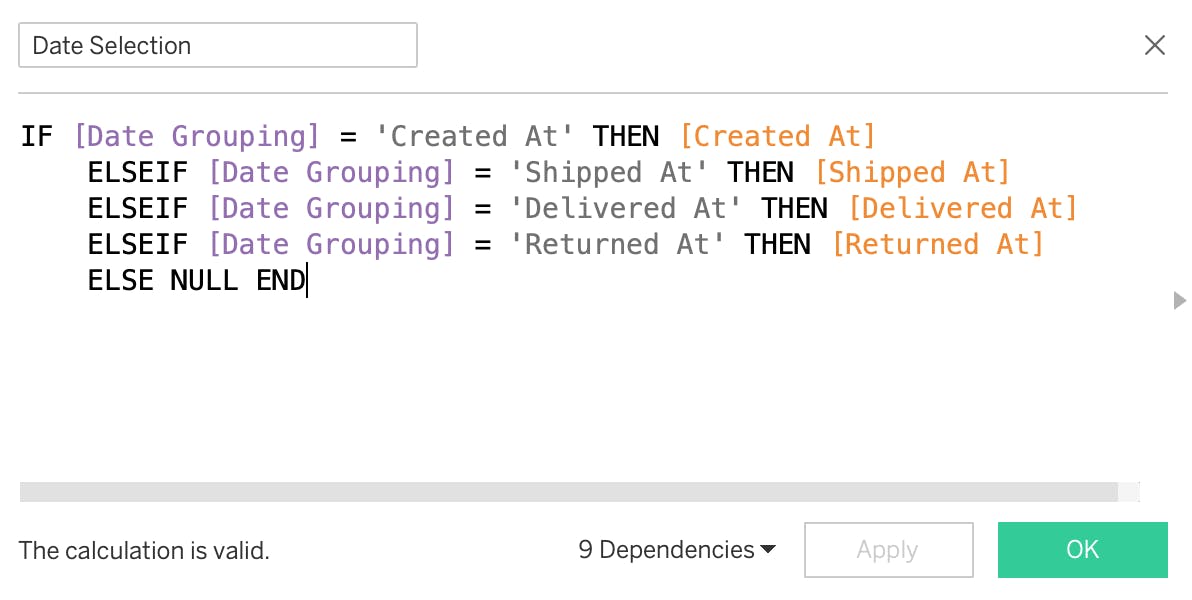
2. Create a Calculated Field:
Go to the "Analytics" pane and click on "Calculated Field."
Name your field "
Date Selection."In the formula box, enter the following:
3. Use the Calculated Field in Rows or Columns:
Drag the "
Date Grouping" field to your Rows or Columns shelf.This will group your data based on the selected parameter value.
4. Use the Parameter on a Dashboard:
Add the "
Date Grouping" parameter to the worksheet.Users can then select
created_atorshipping_atto switch the date grouping dynamically.
Date Aggregation Transformer
Create a parameter allowing users to choose "Daily," "Weekly," "Monthly," etc., for dynamic aggregation based on their timeframe preference.
1. Create the Parameter:
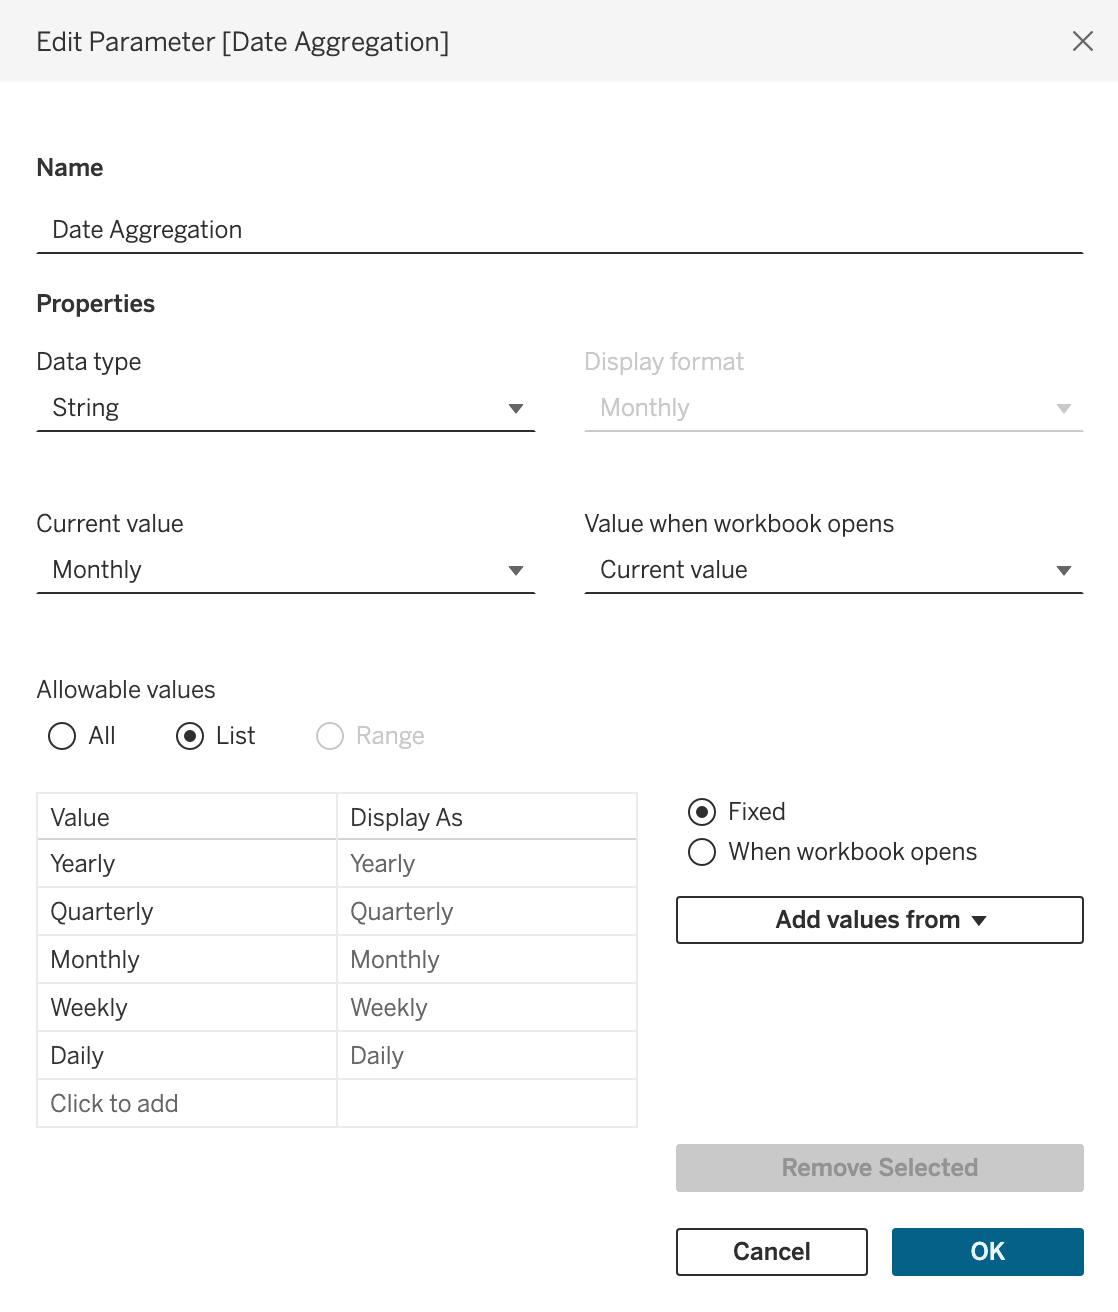
Go to the "Data" menu and select "Create Parameter."
Give your parameter a name, like "
Date Aggregation."Set the data type to "String."
Under "Allowable Values," choose "List."
Enter values: "
Yearly", "Quarterly", "Monthly", "Weekly", "Daily"2. Create a Calculated Field:
Go to the "Analytics" pane and click on "Calculated Field."
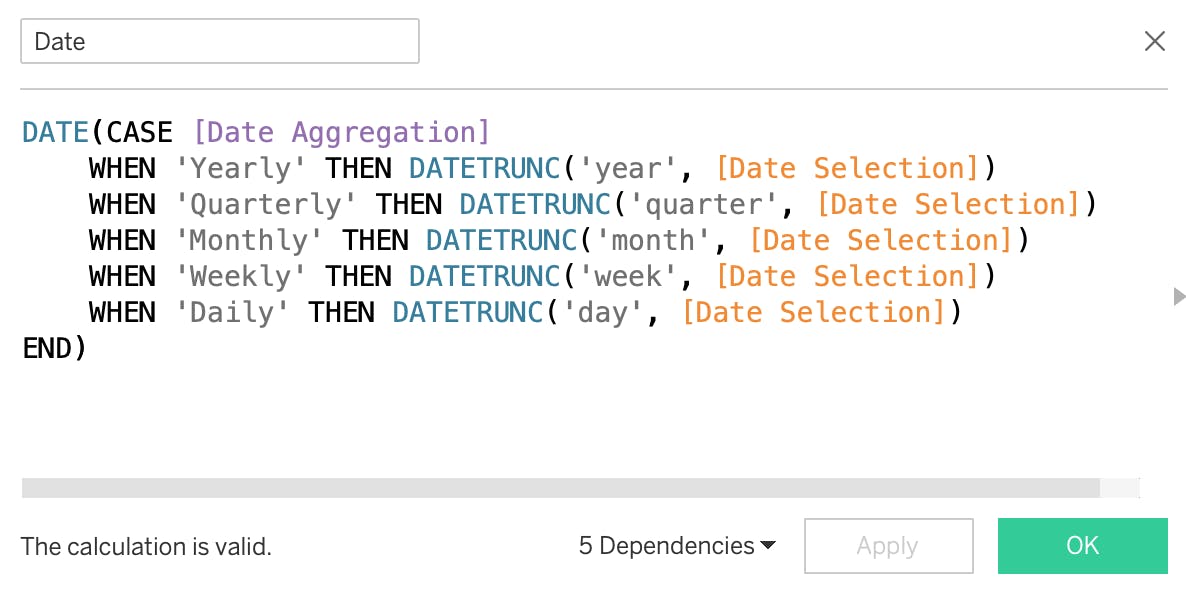
Name your field "
Date"In the formula box, enter the following:
3. Use the Calculated Field in Rows or Columns:
Drag the "
Date" field to your Rows or Columns shelf.Convert "
Date" pill to 'Exact Date'Convert '
Date' pull to 'Discrete'This will aggregate your data based on the selected parameter value.
4. Use the Parameter on a Dashboard:
Add the "
Date" parameter to the worksheet.Users can then select "
Year", "Quarterly", "Monthly", etc to switch the aggregation dynamically.
Dimension Shifter
Empower users to analyze relevant dimension(s) with a parameter. This flexibility allows them to drill down into the data from different angles.
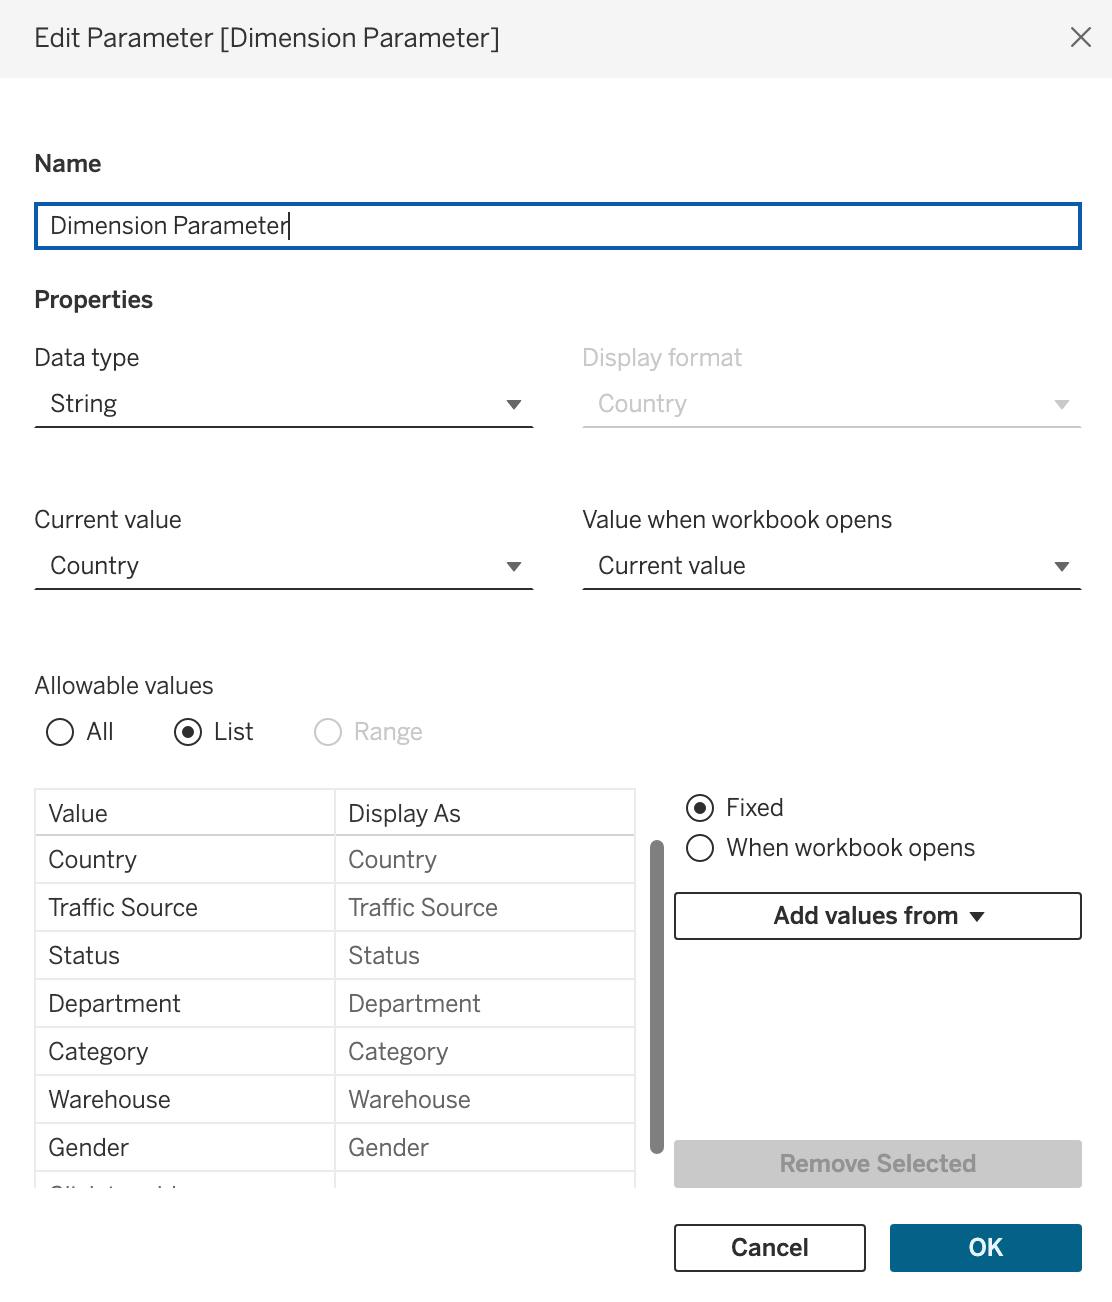
1. Create the Parameter:
Go to the "Data" menu and select "Create Parameter."
Give your parameter a name, like "
Dimension Parameter"Set the data type to "String."
Under "Allowable Values," choose "List."
Enter values for the series of dimensions, for example:
2. Create a Calculated Field:
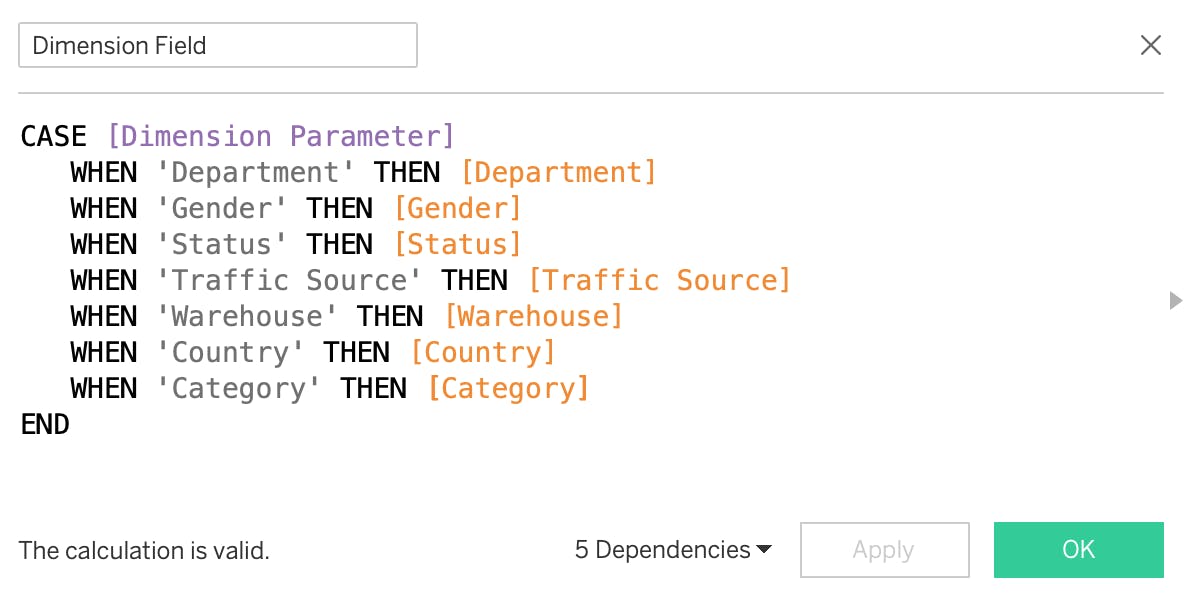
Go to the "Analytics" pane and click on "Calculated Field."
Name your field "
Dimension Field"In the formula box, enter the following:
3. Use the Calculated Field in Rows or Columns:
- Drag the "
Dimension Parameter" field to your Rows or Columns shelf.
- Drag the "
4. Use the Parameter on a Dashboard:
Add the "
Dimension Parameter" parameter to the worksheet.Measures will now be grouped by the selected dimension
Measure Maestro
Swap between relevant measures on the fly. Users can focus on the metrics that matter most to their role with a simple parameter selection.
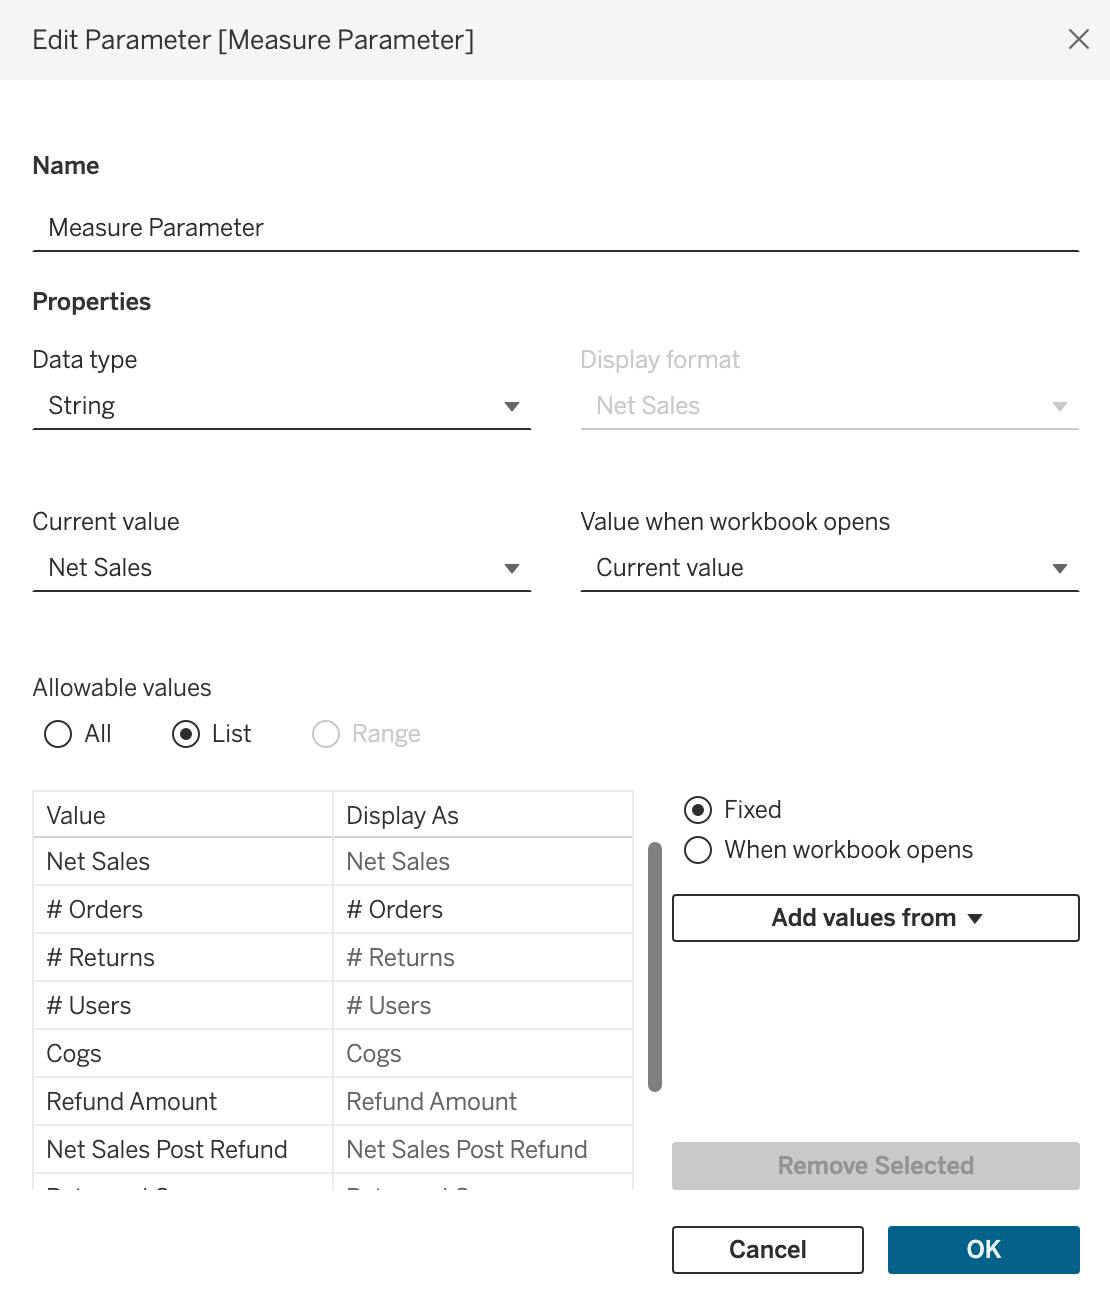
1. Create the Parameter:
Go to the "Data" menu and select "Create Parameter."
Give your parameter a name, like "
Measure Parameter"Set the data type to "String."
Under "Allowable Values," choose "List."
Enter values for the series of measures, for example:
2. Create a Calculated Field:
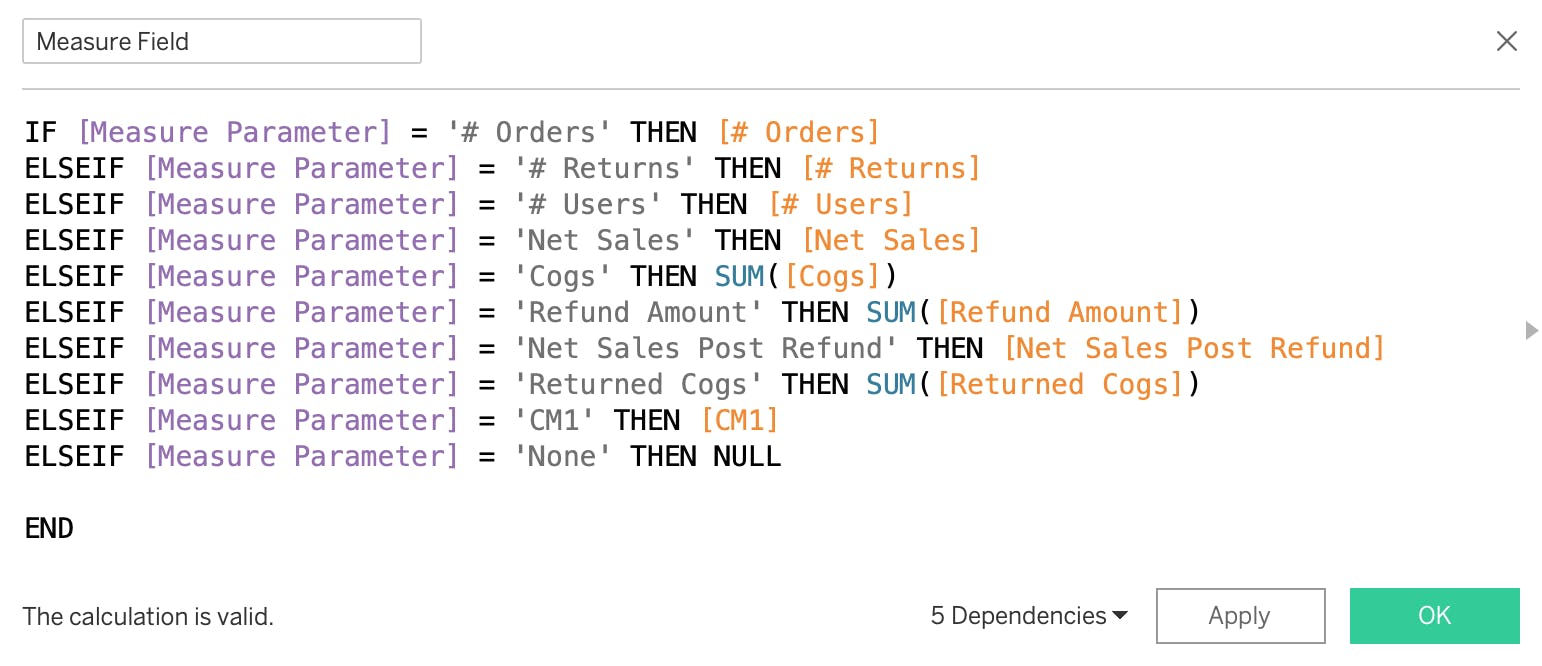
Go to the "Analytics" pane and click on "Calculated Field."
Name your field "
Measure Field"In the formula box, enter the following:
3. Use the Calculated Field :
- Double Click "
Measure Field" field to add to sheet
- Double Click "
4. Use the Parameter on a Dashboard:
Add the "
Measures Parameter" parameter to the worksheet.Users can now toggle between measures
Putting Theory into Practice: A Tableau Demo
Check out the demo I created in Tableau to witness the magic firsthand: Self-Service in Tableau - A Dynamically Filterable Report Example